Your extensive guide to the best psychological principles we've seen is finally here.

Your extensive guide to the best psychological principles we've seen is finally here.
Before the dawn of digital marketing, before buzzwords like “customer-centric” or “consumer behavior”, the relationship between marketing and psychology was little if not void. Enter: psychological marketing!
Psychological marketing (or marketing psychology) is now the cornerstone of any successful company.
Every marketing department will have consulted, hired, or created a team dedicated to carrying out marketing psychology research.
Marketing psychology will indicate your competitive edge in the market and allow you to get a more holistic picture of your customers.
Marketing psychology anticipates buyer behavior by understanding our cognitive biases. As consumers, we are irrational, and our decision-making is largely driven by these innate biases.
Marketing psychology, therefore, applies theoretical knowledge to the marketing field.
Digital marketing capitalizes on this and applies these psychological insights to optimize campaigns, ads, and copy to drive purchase behavior: its smarter marketing across every channel and customer touchpoint!
In this context, buyer behavior and psychology are used in tadem to: alleviate the stress of shopping, as well as personalize, streamline, and elevate customer experiences (CX).
We’ll see how marketers have put psychology into action throughout this article. This is key for brands seeking to compete in the customer-centric digital age.
That being said, we’ve compiled a list of forty-six marketing psychology principles for you to understand and see examples of.
Read first. Implement accordingly. Thank us after.
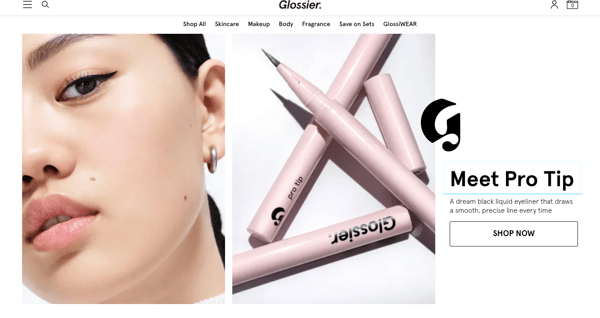
Glossier leverages Authority to boost the trustworthiness of their product; “Pro Tip” infers that this is the eyeliner that professionals use.
Authority refers to the theory that consumers trust people who are in charge.
Markings of authority can either be expertise, titles, uniforms, or recommendations that establish you as thought leaders, experts, or sources of credible information.
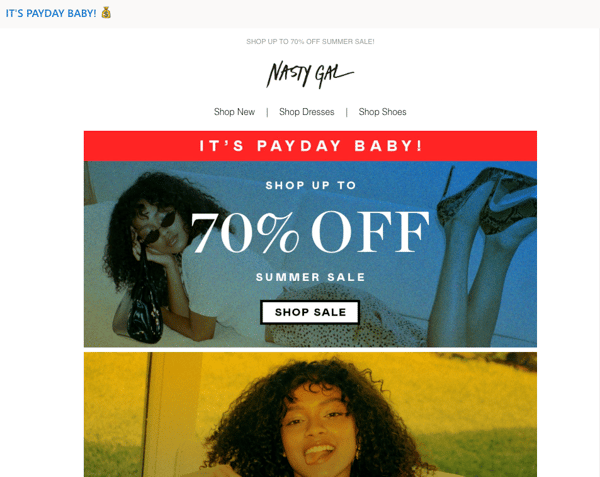
The NastyGal email leverages likeability because it uses the vocabulary of its target audience and shows women that reflect their audience in physical attractiveness and similarity.
Much like our innate responses to Authority, it’s only natural that we respond to things that we like in a positive way.
Liking can be instilled by:
Sure, the discount helps too, but that’s called Price Sensitivity…
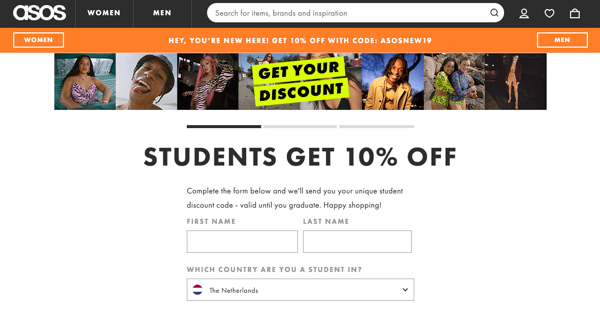
This ASOS discount targets students. So it’s no wonder that they appeal to their tight wallets with a tempting discount.
Understanding how your consumers react to different price levels shows your awareness of your price point, consumer demand, and your operating marketplace.
You should track competitive product prices and analyze which target consumer bases react better to offers or discounts. Because, contrary to popular belief, discounts don’t always drive purchase behavior.
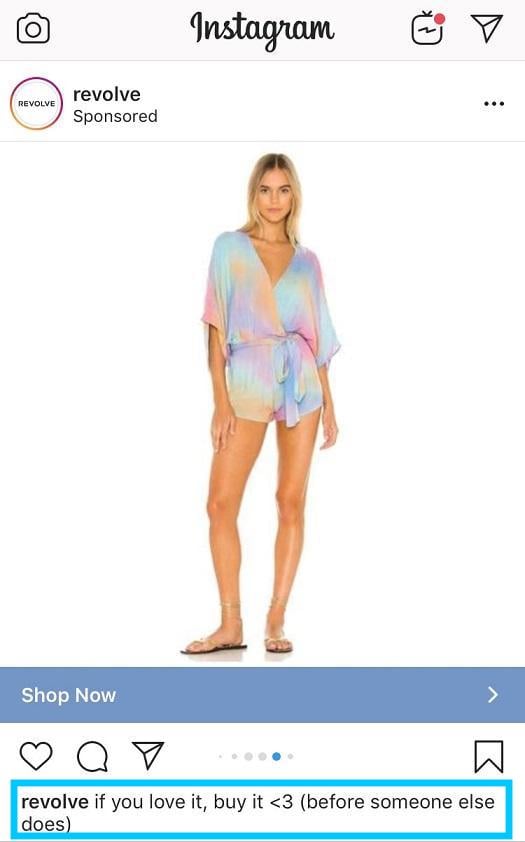
In this Instagram ad, Urgency Scarcity is leveraged by implying that other shoppers will grab the chance to buy this Revolve product. Scarcity instills a sense of urgency in a shopper.
Psychologically, fewer opportunities = a threat to our freedom. We react against this in order to “preserve our established prerogatives” (Cialdini, Influence).
You can leverage Urgency Scarcity by showing a limited number or deadline.
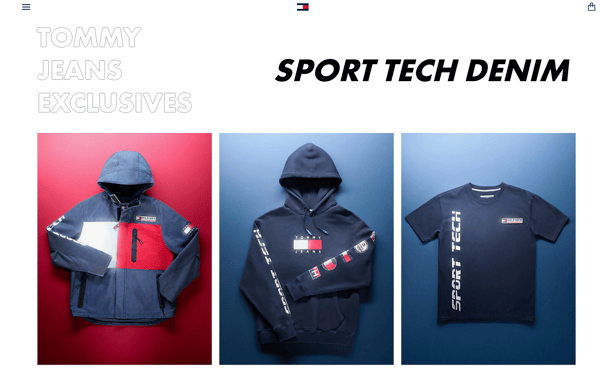
On the other hand, Tommy Hilfiger presents an exclusive line. Exclusive products appeal to people who wish to seek status or establish their uniqueness because they are seen to be of higher value. In this case, rarity implies value.
In order to show Exclusivity Scarcity, you could:
There’s a reason for the laughter track on sit-coms and comedies, even if you hate this so-called “canned laughter”. Cialdini attributes this phenomenon to Social Proof. In other words, doing what other people are doing because other people are doing it.
In marketing, Social Proof can be shown with copy promoting things like:
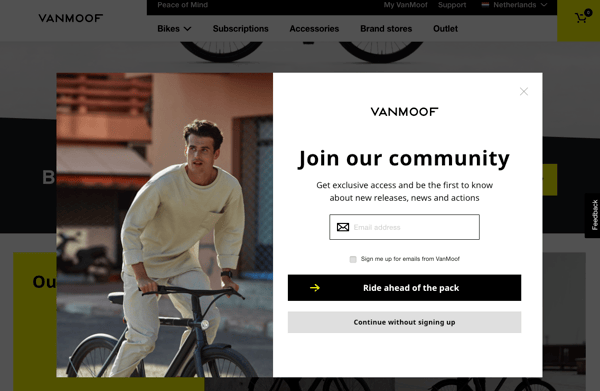
Van Moof leverages Unity by asking their customers to join their community. Unity is also a form of Social Proof because it encourages people to be a part of something.
Togetherness can be fostered by emphasizing a “we mentality” or by framing your campaigns with “be one of the few” or “join the group” (read how the climate change strikes capitalize on this for more information).
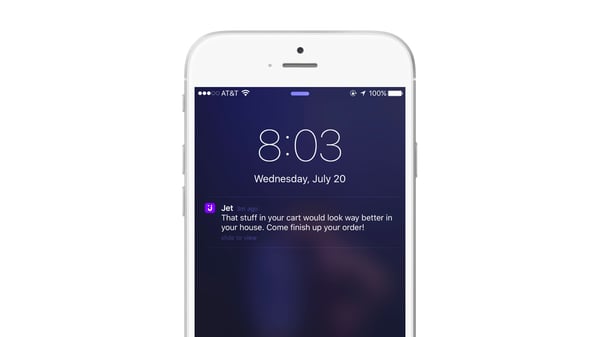
Jet’s notification reminds its customers to remain consistent with their purchases.
This leverages the theory of Commitment & Consistency, which explains that people feel obliged to behave consistently with their commitments.
You could deliver notifications that remind your customers about what they have in their carts or encourage them to sign up for newsletters, campaigns, or offers.
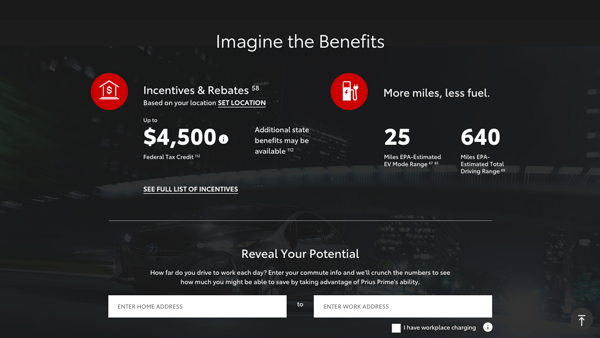
Toyota’s reasons for purchasing is stressed with their “less fuel” characteristic.
“To buy or not to buy?” - People will always weigh the reasons for purchasing a product before checking out.
Especially if it’s an expensive purchase, like a car. Product descriptions highlighting the car’s benefits are reasons why to buy it (i.e., this car has a sunroof), and show how your product has differentiating qualities.
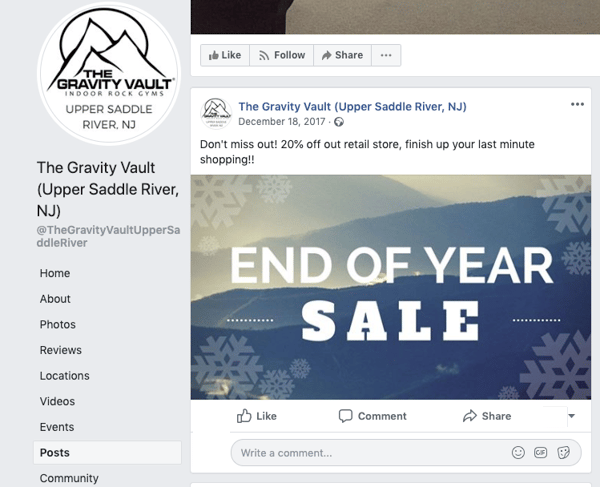
This Gravity Vault Facebook campaign suggests missing out on their end of year sale will be a loss. The psychology of losing something weighs more on a person’s subconscious than when something is won. Individuals will do anything they can to avoid loss.
Loss Aversion is seen in FOMO (fear of missing out), or in how we refuse to give up our place in a queue or our declining crypto investment.
Highlighting this psychology in your copy from retargeting campaigns to banner images will prove highly effective.
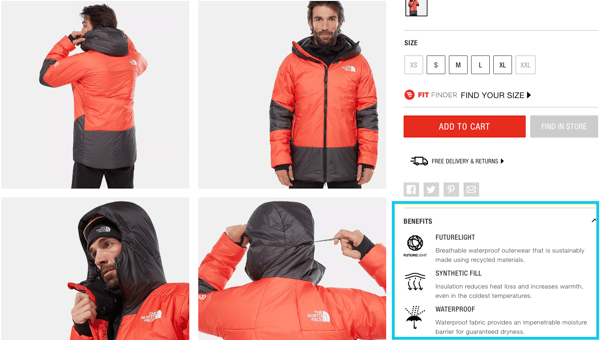
North Face also has four images demonstrating the functional qualities of their jacket and product USPs. This focuses the attention of the shopper on what North Face wants to highlight about that specific product.
As you are probably aware of by now, your customers only have a limited number of cognitive resources available to them. This means that they may need a bit of help when focusing their attention.
Use product tags, labels, zoom buttons, or heat maps to draw user attention to what matters.
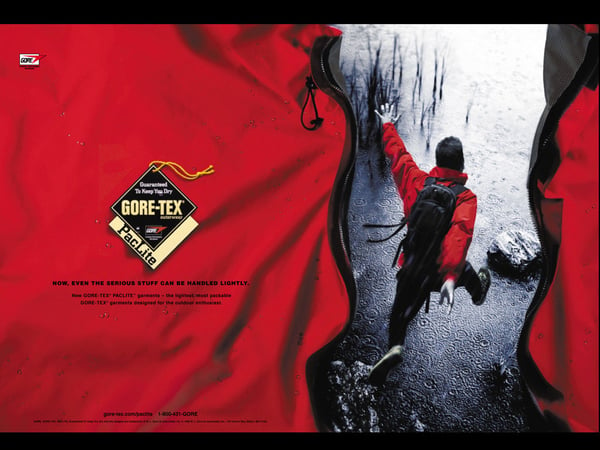
Imagination is at the core of any good storytelling, and storytelling powers great marketing. Gore-Tex shows us a story of their product, making it easy to imagine how purchasing the product leads to this lifestyle.
Implementing the Just Imagine Technique means:
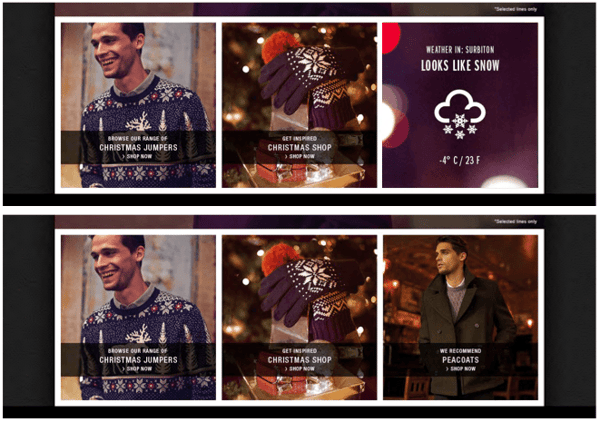
Burton has a weather API that delivers product recommendations corresponding to the season.
This applies Weather Effects, a projection bias that suggests tailoring your marketing strategies to the current weather. For example, studies have found that on gloomy days, we feel more risk-averse, and on sunny days we feel more risk-seeking.
Tailor your copy and product recommendations with the weather in mind. Or use a weather API to track local weather and deliver campaigns based on this.

“Beer before liquor never been sicker, liquor before beer you’re in the clear”: how many of us go by this incorrigible truth? A bit like this vintage Jaguar ad above.
Aphorisms are often rhymed and this is because rhymes are easy to remember and seem as more truthful than statements that don’t rhyme.
Your copy can reflect this from your brand vision to your campaigns.
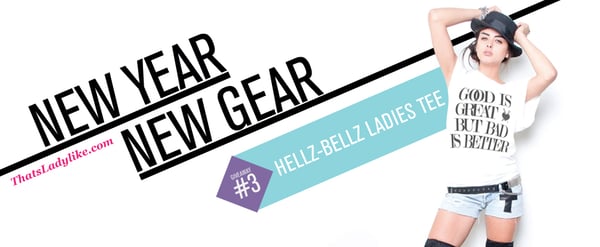
Here’s another rhyme for you: new year, new gear! This also leverages the Fresh Start Effect which, like its name suggests, appeals to our regenerative desires.
To see this at work, your campaigns can correlate to starting off the week or declaring a new season (see Back to School tips).
You could even jump on events (birthdays, New Year's). In general, the idea of newness or starting with a blank slate will drive purchase behavior within your copy.
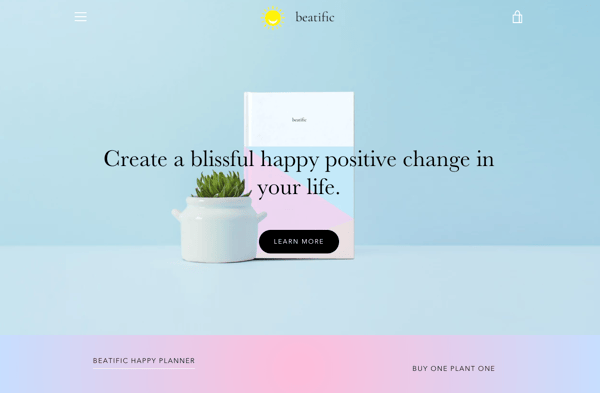
Speaking of “new”, why is it that we are drawn to this word?
We are also drawn to words like “Free”, “Happy”, “Love”, “Save”, “Wonderful”, “Joy”, “Winner”, “Power”, “Strength”, “Passion” - you get the idea.
These are called God Terms, a terminology cluster invented by Kenneth Burke designed to inspire positive feelings of moral value within us. Rhetorical words or sentence structures can be used to elevate your marketing in an inspiring way.
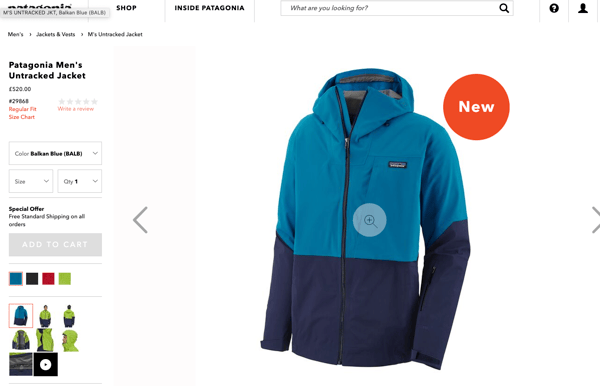
In fact, Patagonia uses the word “new” as a product tag. This is actually based on a psychological theory: emphasizing things that are “new” will drive purchase behavior for people who like Novelty products.
For marketing channels, this can either be placing a “New” product tags on your webshop or in-store products or having a Novelty campaign built on presenting new items.
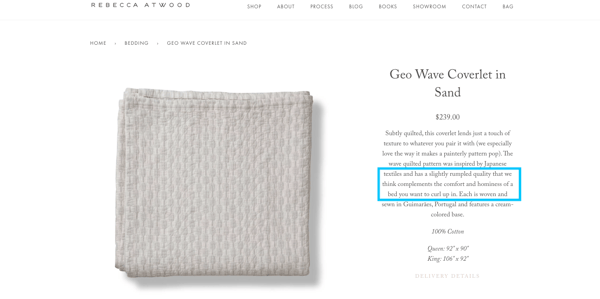
Rebecca Atwood primes the visual of their product in use in the shopper’s household, and suggests how good it would look.
When our behavior doesn’t match previous beliefs, we tend to change our views in order for them to match our behavior. So for this Rebecca Atwood product, the description “we think complements the comfort and hominess of a bed you want to curl up in” primes its purchase.
For marketers, it’s thus your job to prime the idea that your consumers like your product to increase the likelihood of that behavior (i.e. “we think you’ll love…”), or imply how well it would fit in your customers’ lives.

What’s better on your bank: using a $3 condom or having a baby - a financial investment for life? Anchoring is the cognitive bias that influences how we view a product by comparing it to something else.
This is often seen with discounted prices (crossing out your previous price offering and comparing it with the new one).
It can also show your product benefits and how they excel compared to another, competing product.
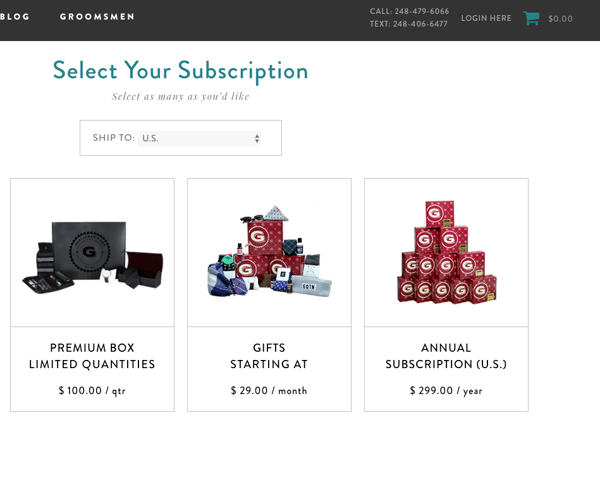 For this “Gentleman's Subscription Box” three options are provided, with the high-priced package making the other two more appealing (this works well when reframing prices of subscriptions, for example).
In much of the same way as Anchoring, persuasive pricing techniques establish mental shortcuts (or: heuristics) to streamline decision-making.
The Decoy Effect usually presents a decoy option to help your customers make a purchase better decision. This also alleviates the anxiety of seeing a massive jump in price from the lower to higher option.
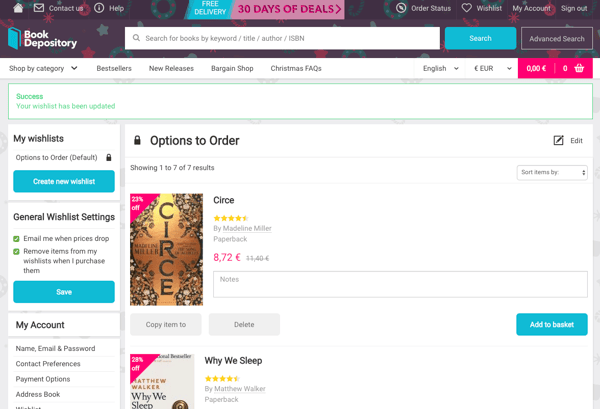
Book Depository has a wish list to allow shoppers to choose from various options they have curated whilst browsing, thus inducing Autonomy.
Make your shoppers feel autonomous by providing them with options to:
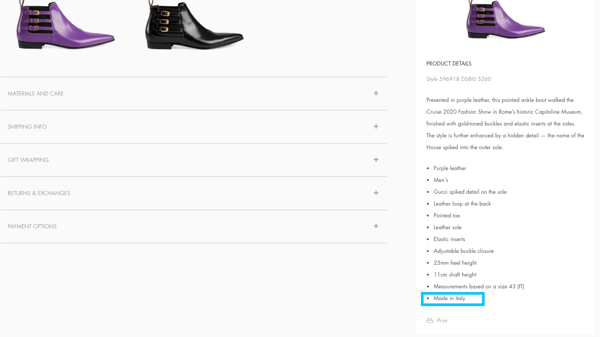
Gucci embeds “made in Italy” in the characteristics of their shoe, becoming another product benefit.
Psychologically, this is very effective, because we associate certain countries with competencies in product manufacturing (the Swiss make good watches, right?).
These stereotypes can actually be a positive thing if you have products that originate from a country associated with quality.
You can also promote the country of origin by using icons or tags showing the country.
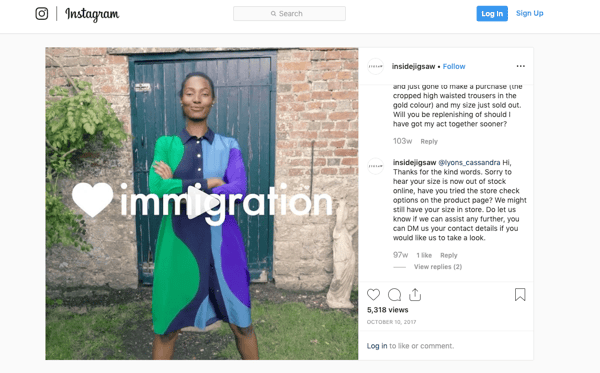
In 2017, the fashion retailer Jigsaw ran an omnichannel campaign called “Love Immigration” that celebrated diversity and the benefits of immigration, giving them a Noble Edge.
The Noble Edge Effect means that in order to boost your brand reputation, equity, and have people remember you:
However, there’s a caveat: you have to be authentic and transparent in whatever noble deed you choose to associate your brand with.
Audi made the mistake of promoting feminist values as a marketing campaign without checking their imbalanced gender ratio at the exec. level. This resulted in mass backlash and resistance from their customers. Aud(i)acious.
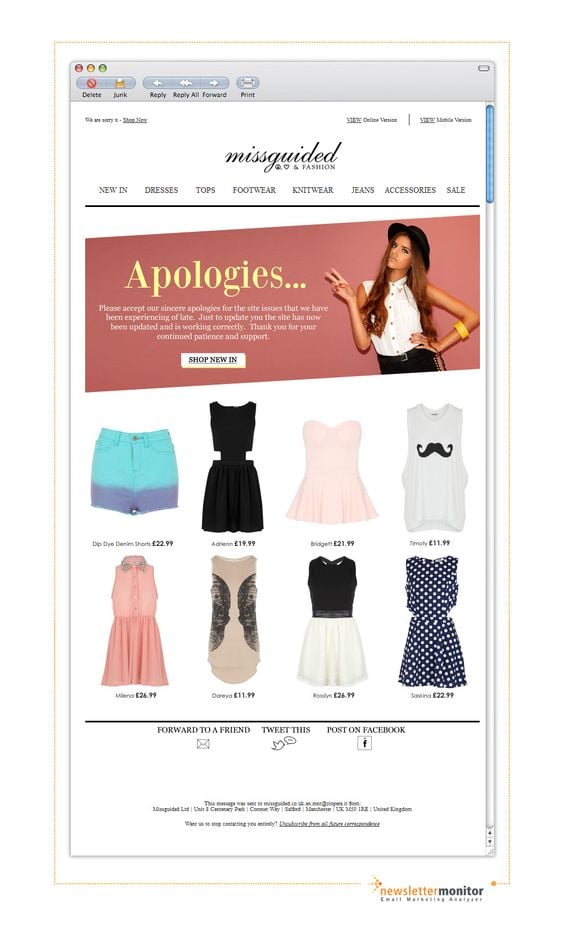 If your brand does make a big oopsie (like Audi), however, you should be able to apologize.
When authoritative figures make minor mistakes, say they are the underdog rather than the front-runner, or make use of their flaws in any way, their attractiveness actually increases, making them more relatable. This is called the Pratfall Effect.
Use your media channels to acknowledge brand imperfections, especially when mistakes are made, or create smart notifications apologizing for slow connections or when you’re stock is low.
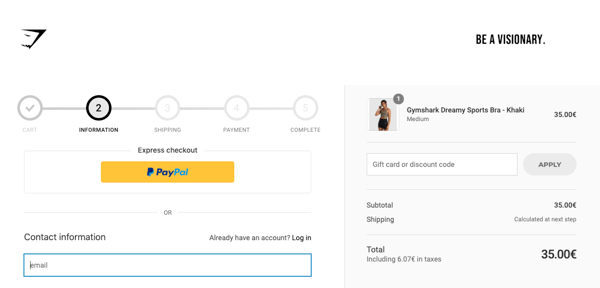
Gymshark shows how far you are in the checkout process, leveraging The Goal Gradient.
The theory suggests that people are more motivated to keep going when they can see how far they’ve come and how close they are to a goal.
You could drive conversions by showing progress on your checkout page, or (for loyalty programs) offer visible progress of reward points for customers that are logged in (Dynamic Messages that can be leveraged on any eCommerce page).
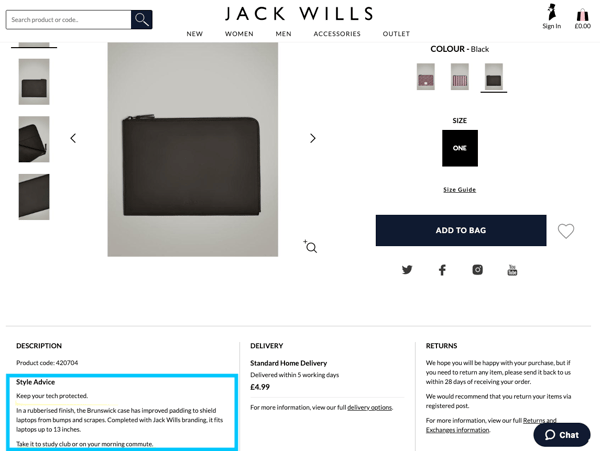
Jack Wills frames their product with “take it to your study club or on your morning commute”. They frame their copy to match their customer’s lifestyles, needs, and desires, including how their product would complement these.
When consumers process information based on what is most relevant to their needs this is called Selective Perception.
Make sure you carry out mature market research, focus groups, surveys, interviews, and online A/B testing (for webshops).
This helps you to understand your target audience better, the language they use, and what information will make them convert to optimize your customer segmentation.
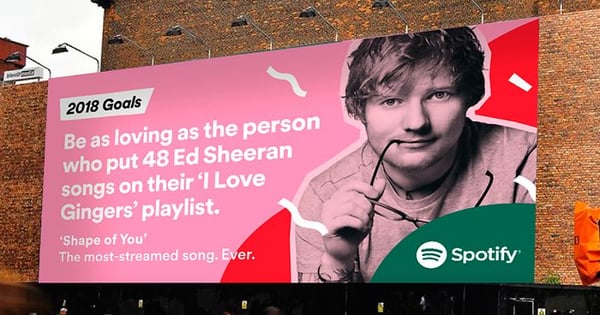
Apart from being a clever example of data-driven marketing, this Spotify campaign also leverages the Generation Effect because it generates a whole ad from their customers’ song interests.
Information that is generated by the consumer is better remembered than information that is given.
You could leverage this by reminding your shoppers of their cart purchase, i.e. “Last time you were on your site you added these items to your cart. Great choices! Ready to continue?”
Why is the Spotify Ed Sheeran ad above so great? Partly (as well) because it’s funny. Humour makes things easier to remember. It alights our senses and produces liking.
Coupled with visual storytelling and self-referentiality and you have an award-winning commercial like the Tide Ad above.
Parody, satire, pop-culture references, or placing celebrities out of their comfort zone are all tricks of the humor trade in marketing.
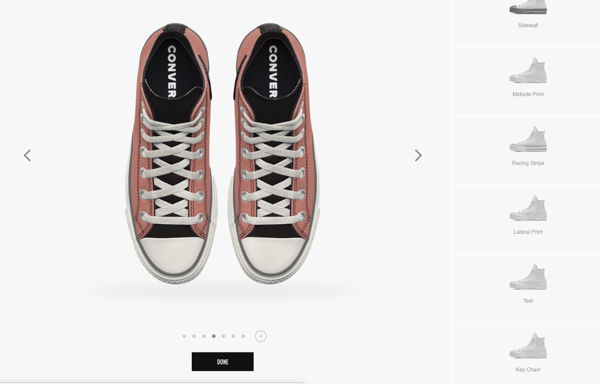
Converse personalizes the experience by letting their shoppers customize their own shoes.
This leverages another trick of the trade aptly called the IKEA-effect. The theory suggests that we endow objects with more value and meaning if we assemble them ourselves.
You could still leverage the IKEA-effect without enforcing manual labor by creating interactive experiences of your products or by allowing your customers to build, design, zoom in, pinch, or change color.
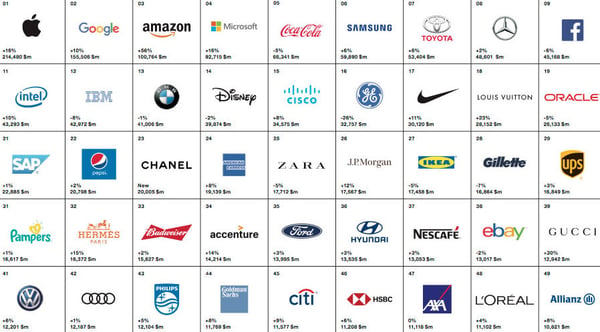
If you look at the world’s top brands, you can see a trend in brand names: none exceed three syllables and are often words already that are already in our vocabularies like apple or Amazon.
The Speak-Easy Effect refers to cognitive fluency (which we’ll talk about next). Basically, the easier something is to read, the less risky it seems and the better it will resonate with your customers.
Keep things simple stupid, from campaign legibility to brand narrative to webshop design.
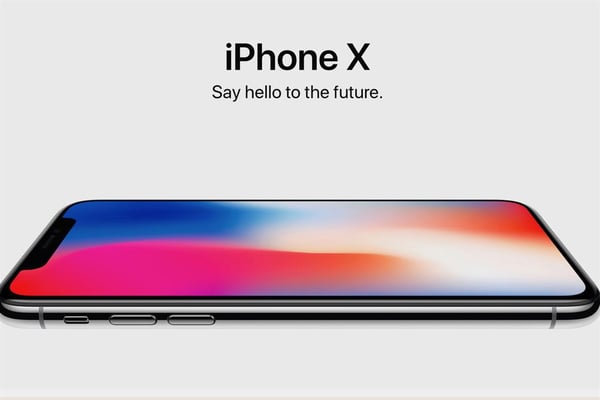
iPod is the master of keeping complex things simple. Whilst things that are easy to read have more of a lasting impact, things that are designed in a “fluent” way will similarly appeal to our senses.
This is because we resist too many choices, have limited focusing attention, and prefer minimalism, symmetry, and white spaces when processing things for the first time.
Read up on Persuasive eCommerce Design for more.
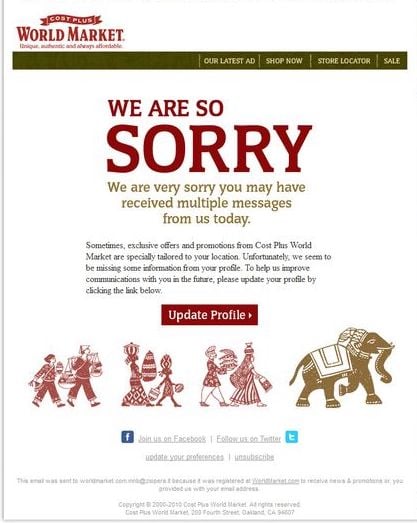
Here, World Market acknowledges their aggressive email campaigns...in an email campaign.
However, this is effective because it acknowledges resistance. Resistance to marketing persuasion is becoming more and more common these days.
If you can acknowledge resistance, therefore, you will:
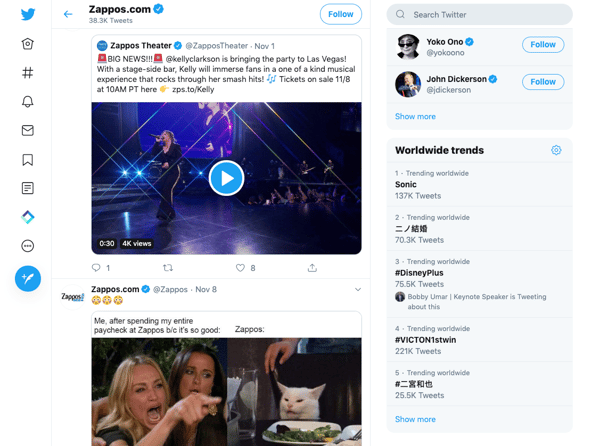
Zappos tweets consistently, using the language of their target audience (i.e., using memes and pop culture references). This feels like they are everywhere at once, and familiar.
The Mere Exposure Effect suggests that the more familiar your customers are with your brand, they will place you on a higher esteem. You should have a consistent presence across multiple channels (email, ads, brick-and-mortar) and social media platforms.
It also means using repetition in your ads if you want to promote a particular USP.
Personification is originally a literary trope in which an object comes to life with human traits or emotions.
In marketing, this can be a metaphorical way to increase the relevance of your brand or product, or make people laugh (like the PC vs. Mac commercial).
Personifying your brand starts by communicating your brand identity and values on all your online communication.
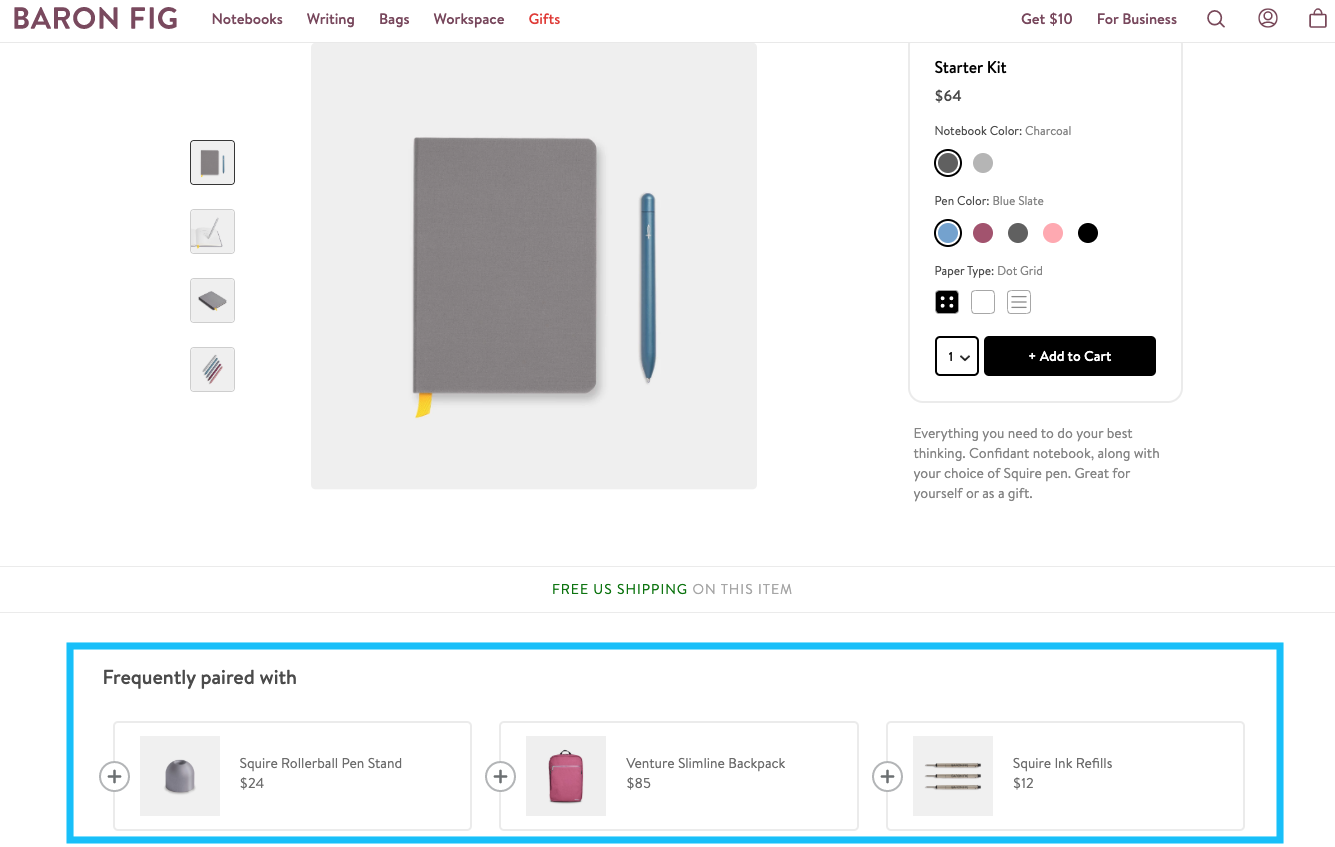
Baron Fig gives us an idea of what their "starter kit" would look like if it were completed. Everybody likes products that complement an outfit, or recommendations that complete a look or set.
Additionally, people like to finish a task so they can move on to the next, so notifications like “Buy x to complete your look!” will also tap into the psychological tendency of Set Completion.
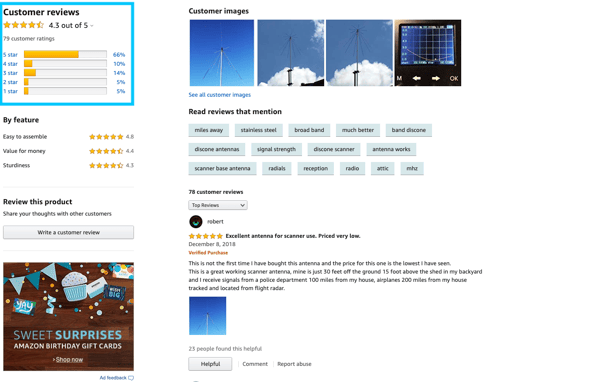
Amazon is renowned for their honest product reviews. In this example, however, they have 66% 5-star reviews, and 5% 1-star reviews.
Although bad reviews may seem like a negative thing, the 5% is a small blemish on the good reviews, and actually serves to boost Amazon’s honesty and relatability.
This is called the Blemishing Effect, and can make a product or brand look more attractive by displaying weak negative information.
Read more on leveraging customer data like Amazon.
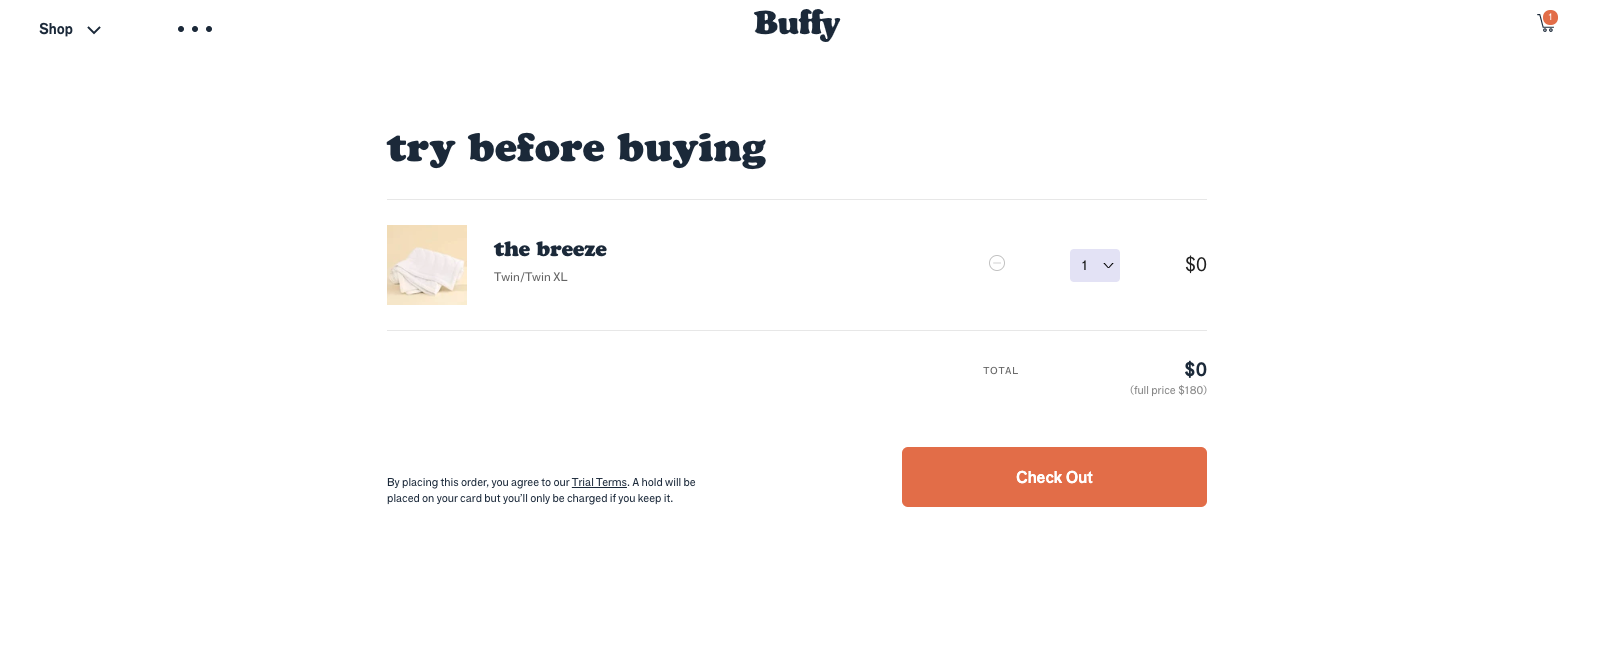
Buffy offers a "free trial" of their sheets before committing to payment. The Endowment Effect is when the value of an object increases when it belongs to someone. So after a trial, we are less likely to give the object up (see 10. Loss Aversion).
It’s a cognitive bias that sees consumers place more weight on things in their possession (this starts to take effect simply by holding something!).
Thus, you can leverage the Endowment Effect by:
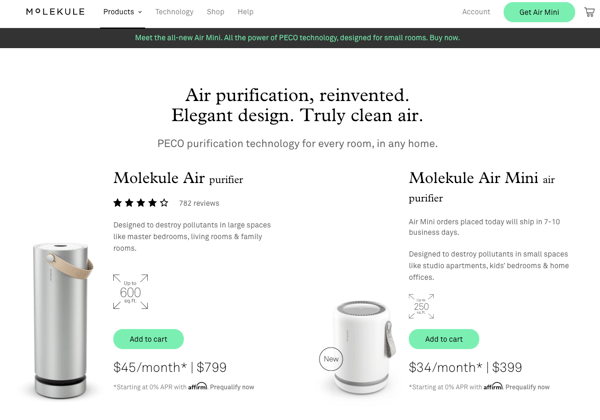
Can you believe that this Molekule webshop only has two purchase options?
However, the fewer options the better. Coupled with their minimalist design Molekule significantly reduces the stress of shopping whilst solidifying their offerings and brand identity.
Choice overload will inflict consumers with anxiety and could cause friction between you and your customers.
Don’t overload your website (see 31. Cognitive Fluency) with too many choices, from your product lister page to checkout.
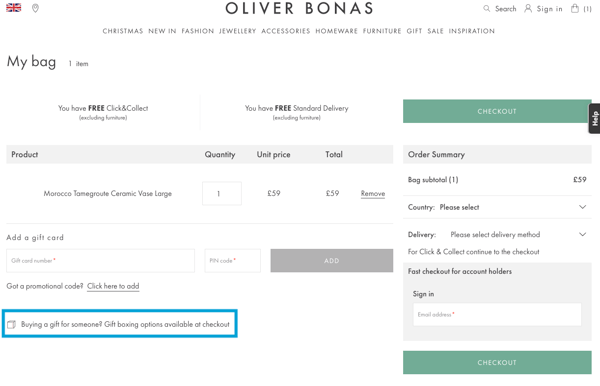
Oliver Bonas provides the option to have gift boxing at checkout (checkout + 1, basically). Hobson’s +1 Choice is, therefore, a psychological nudge you can use at checkout to ensure you aren’t left with those horrible abandoned carts.
This means giving your shoppers an extra option to streamline decision-making and make them feel autonomous (see 21. Autonomy) in their transaction.
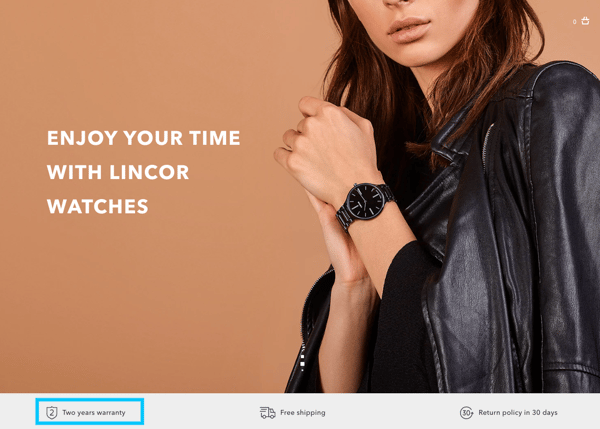
This watch retailer gives a two year warranty below the banner page, and it becomes part of the brand USP.
For investments or products that are expensive, guarantees are important to gain the trust of your customers.
You could either create whole campaigns around being the brand that gives “money back” to dissatisfied customers, or include a warranty clause as a product label.
For more on product badges and when to use them, go to the Crobox Knowledge Base.
If you can provide guarantees on your products, then this will influence how people view your overall brand in other areas. This is called the Halo Effect: when a positive impression of something influences similar perceptions in other areas.
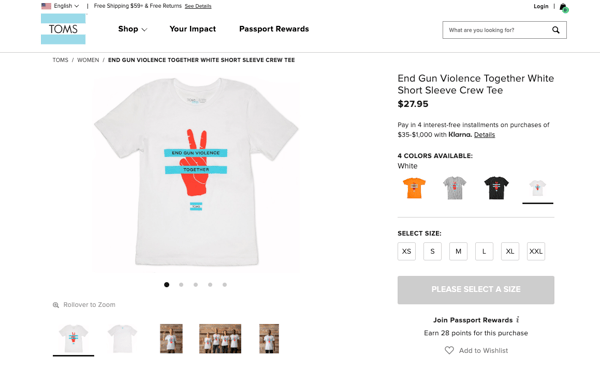
Toms shares their anti-gun t-shirts. By taking a political stance, the brand becomes associated with an anti-violence optimistic stance, which will boost their overall brand perception in other areas.
You can leverage the Halo Effect in different ways:
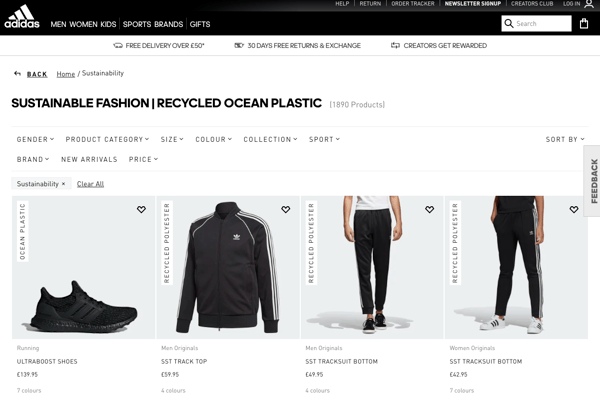
This Adidas example uses product tags to emphasize their use of recycled materials. Injunctive norms suggest the way we ought to behave in society, and can inform shopping behavior when it comes to sustainability messaging.
Use product tags or targeted campaigns to show how your brand is participating in approved behavior, or highlight your injunctive norms as in your brand USPs, product descriptions, or across your socially engaged campaigns.
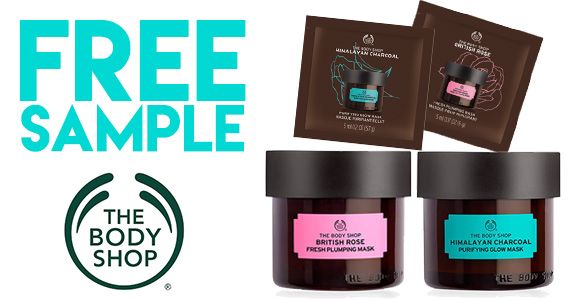
Body Shop applies Reciprocity by giving out free samples. This relies on the give-and-take principle intrinsic in human exchange.
When making a decision, consumers will be more inclined to “give-back” to appease this innate reciprocal instinct.
Giving out free samples, trial periods, or free advice (e.g., blogs with extensive lists of information hint hint) will instill a sense of Reciprocity in your customers.
Amazon provides in-depth product descriptions (seen especially here on their Kindle product page): the more information about a product that a shopper is given, the more valuable and of higher quality it will seem.
That being said, you should make it easy for your customers to find this information. Use different styles of information like reviews, visuals, or recommended products.
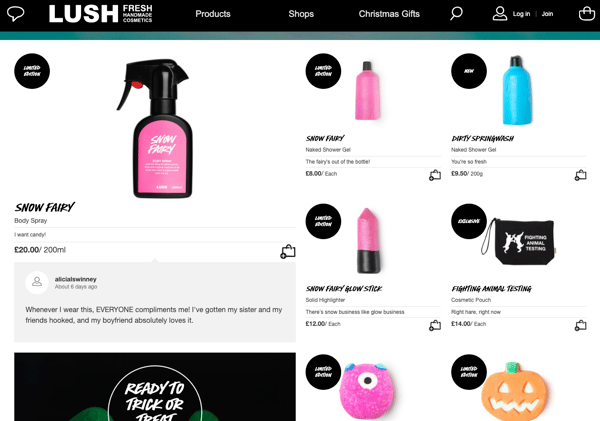
Lush uses product badges to trigger purchase behavior. As we've already discussed, the product badge "Limited Edition" will appeal to our Scarcity impulses (see 5. Urgency Scarcity).
Nudge marketing is based on implicit prompts that will subtly drive purchase behavior. The nudges for Lush are those product tags.
For eCommerce, Nudges can be used to optimize the customer journey by using:
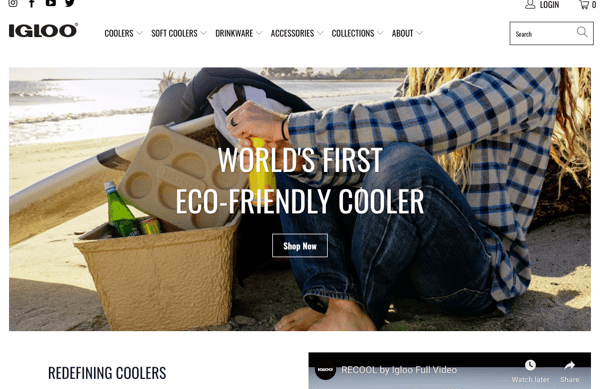
New gadgets, revolutionary tech, and being the “first of its kind” like this eco-friendly cooler: these are all ways to leverage the Pro-Innovation Bias.
Psychologically, consumers enjoy being the first to try something new and will overlook a product’s shortcomings if its innovative features are emphasized.
But all your products are perfect, right? Pushing how they are innovative will simply give you that extra marketing edge.
To wrap up, marketing psychology will give you a competitive edge in the digital market.
More than this, understanding and anticipating consumer behavior will enable you to get closer to your customers and provide them with elevated shopping experiences.
Believe it or not, but this extensive marketing psychology list is just the tip of the iceberg when it comes to consumer psychology and marketing.
It’s up to you to find a balance between all of the above that lets you keep a solid brand image, whilst creating products, experiences, and campaigns that your customers will continue to love.