Like many retailers struggling for relevance in a market governed by pure players - the data question is a Big One.
Like many retailers struggling for relevance in a market governed by pure players - the data question is a Big One.
Do you feel like you’re drowning in data?
Are you worried you can’t continue to personalize the CX without infringing on data privacy laws?
Whether you’re a big eCommerce team with a high digital IQ or a small and growing one, you’re probably trying to tackle these questions by investing in a solid analytics foundation.
But here’s the thing.
You can’t compete with pure players without collecting, observing, and sharing your eCommerce product data. eCommerce product analytics data are the data points that will allow you to stay within data laws, while still personalizing in the way you want.
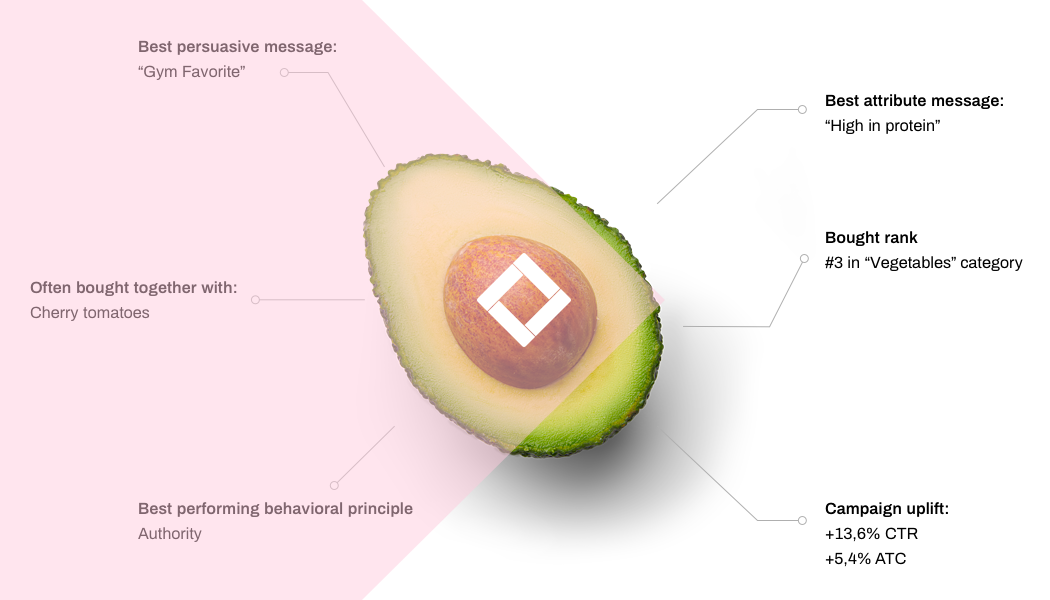
Imagine you’re selling avocados.
While you may infer that avocados are all the rage for millennials, how do you know your “milennial-avocado-campaign” is working?
How do you know your product messaging is resonating?
Without your eCommerce product analytics, you may as well be selling processed beef to a vegetarian Gen Zer.
The key to your product analytics is about making this data actionable. You need to start turning your product data into actionable and digestible insights. This will help you take the pure-player veterans out of the game.
And guess what? It all starts here.
This article will answer your data privacy questions, show you why you should track your eCommerce product analytics, and then show you exactly what types of analytics to track and how.
Plus, some bonus product intelligence metrics to kickstart your personalization and create a more data-driven merchandising strategy.
eCommerce product analytics is the data you collect and analyze about your products, to understand how they perform across your webshop conversion funnel.
This means collecting a myriad of data points and then centralizing them into a product analytics platform. To build a holistic picture of the who, what, where, and how of your products.
In other words,
Much like customer analytics, product analytics is also data about how your users engage with your products throughout their buying journeys.
But unlike customer analytics, there’s an element to product analytics that will especially help you compete in the future of eCommerce.
Drum roll, please.
Remember Facebook’s privacy scandals? Dark Patterns?
Or that feeling you get when you see a targeted ad about something you only just talked about with a friend?
This extensive report from Harvard outlines policies about eCommerce data privacy. It’s clear that the question of how to protect customer data is becoming top of mind for many brands.
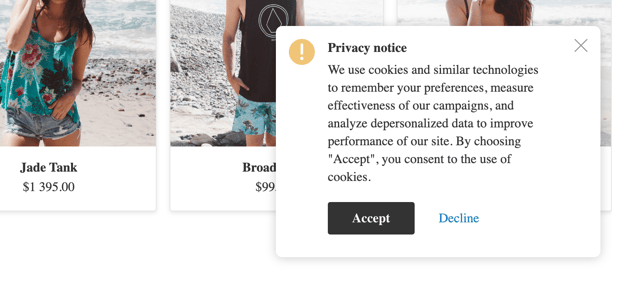
Meaning, you need to look into new ways to collect data and learn about your customers’ behaviors and profiles - without coming across as creepy.
Enter: Your eCommerce product analytics.
By flipping the magnifying glass to look at product data, retailers can phase out third-party cookies and carry out personalization on a product level.
This product-driven approach still analyzes how customers interact with your products. But leverages product analytics instead to create actionable insights.
Allowing retailers to stay within data privacy policies is just the beginning. Why else would you invest in tracking your product analytics?
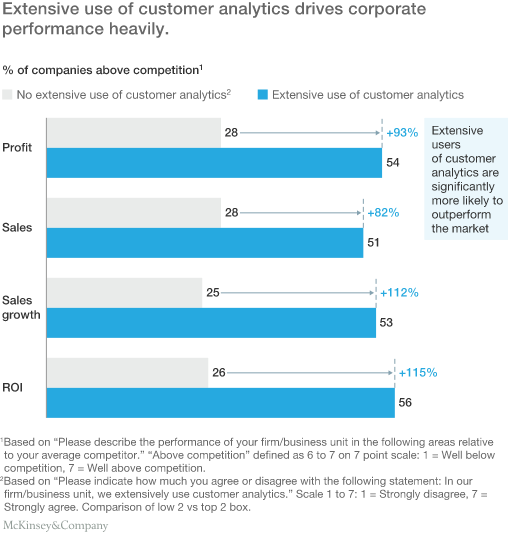
According to Deloitte, 49% of organizations say analytics is the greatest asset in their decision-making. 16% say analytics enable key strategic initiatives. But this is steadily on the rise:
96% of people feel that analytics will become more important to their organizations in the next 3 years.
Tracking and analyzing your eCommerce product analytics won’t just give you insights into how your products perform and enable some pretty savvy segmentation.
It’ll also enable business-wide impact like:
“You need to set up your eCommerce product analytics platform because this will also help you identify which products are worth optimizing. After all, products that sell themselves may not need additional help. And ones that fall short may need a campaign boost. All of these insights can only be derived from a solid analytics foundation.” - Leonard Wolters, Chief Data Officer at Crobox
To sum it up, tracking eCommerce product analytics will help you:
There are A TON of product analytics you could be tracking. From Google Analytics to standard data conversions to behavioral data.
The list is endless.
Of course, what you track depends on your business goals. Which are dynamic and call for continuous optimization.
But let’s circle back to our 1) Measure, 2) Improve, 3) Inspire framework when choosing what eCommerce product analytics to track.
What you want to learn is how you can leverage your analytics to improve and inspire your products. With that in mind, I recruited the help of our in-house data scientist.
Together, we came up with nine eCommerce product analytics that are directly actionable.
We’ll even show you what you can do with the data from these nine unique metrics.
This data point shows how many people who are accessing the product are actually buying it. For example, if 100 people see the product, but only 10 people buy it, your look-to-book ratio is 10%.
How do I leverage this product analytics data point?
Coined from the hospitality sector, this is one of our favorite data points because you can start to analyze what unique characteristics of your product encourages people to buy it.
It’s especially interesting if your look-to-book ratio is low. This could tell you something about your pricing strategy.
For example, it’s clear your shoppers are interested in the product but not checking out. Price can be an obvious pain point here. So are things like additional costs.
To avoid this offer transparent pricing, detailed information, add a product comparison, or a product recommendation that completes the outfit.
Learn about the psychology of pricing to take your pricing strategy to the next level.
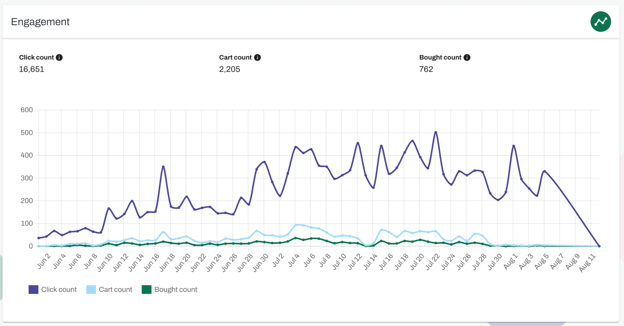
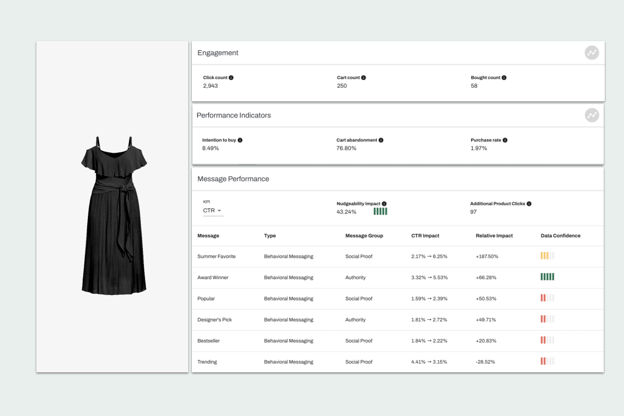
Engagement data like cart abandonment and purchase rates can be useful to see trends and seasonality as well as understand when customers are shopping on your site.
How do I leverage this product analytics data point?
“Engagement data is really useful to apply to your product presentation. Meaning, how you choose to showcase and communicate your products to your customers. In fact, this is the crux of personalization. You (or sometimes your AI/ML) learn from how individuals engage with your products and then optimize so they see the products they want, in the sizes and colors they want, with the messaging most likely to drive their behavior.” - Leonard Wolters, Chief Data Officer at Crobox
Cart abandonment analyzes how many people add a product to their carts/baskets and then leave the products there without checking out.
For example, if a product has a high cart count but a low bought count, this could be an issue of abandoned carts.
How do I leverage this product analytics data point?
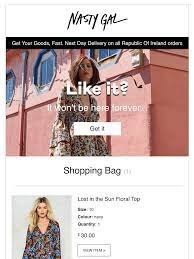
Send your customers re-targeted emails so they don’t forget what they’ve left behind in their cart.
Or, re-target on-site to nudge them back to their shopping carts and drive purchase behavior. A high cart count but low bought count could also mean they’ve experienced a psychological barrier when checking out.
Ease the decision-making journey by adding a product finder, product badges, or smart notifications to provide information, persuasive nudges, and re-instill confidence in your shopper’s buying behavior.
If you analyze that a product has been clicked on but not checked out, there may be issues on your product detail page (PDP) you should optimize. This could be anything from product information, to website bugs, to added costs on the PDP.
If you offer free shipping, say it from the detail page. If you don’t, say how they can get it (e.g., “Add three more products for free shipping!”), or be transparent with the extra costs early on in the customer journey.
Read about website fluency to create a more psychologically appealing CX.
Low purchase rates could be a problem with checking out, with friction points like:
How do I leverage this product analytics data point?
Things like overlays, smart notifications, and overlays will take you closer to dynamic communication.
By keeping track of your inventory count in a centralized dashboard, you can benchmark your products, track their performance, and relay stock messages to the customer on your webshop.
How do I leverage this product analytics data point?
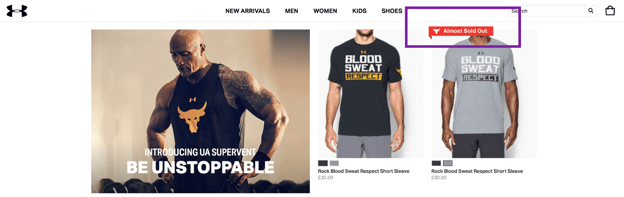
For example, if something is about to be sold out in your inventory data, you can place the dynamic badge “Nearly gone!” over it to inform your customers and develop buying urgency.
Social Proof messages can be added to products that are selling fast.
Or, if you have the data for it, “Only two left!”. This messaging leverages the behavioral principle of Scarcity and drives shoppers to make quick decisions, removing hesitation.
Leverage this metric in your eCommerce product analytics for predictive stock management to get ahead of the game and keep your communication both transparent and persuasive.
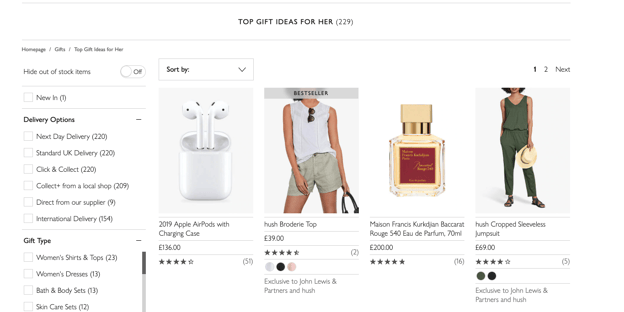
Product page views are the number of distinct individuals that are viewing your product or visiting your product page across a given time.
With this, you can count the number of unique visitors seeing your product pages, regardless of how often they’ve requested the page. (e.g., Amazon used to receive an average of 120 million unique visitors every month).
How do I leverage this product analytics data point?
If the number of unique visitors to a product is high, this shows the product is either special or a one-off kind of product (think engagement rings or similar occasion gifts).
Which means your product is a hidden gem, and you can market it as such. For example, if your analytics shows that your product is often bought as an occasion gift, try creating a campaign around it leading up to the occasion to boost its awareness.
But for a more consistent approach, you can also see your very popular products that appeal to your core audience. Promote these in your social media campaigns to get more traction.
Read about shopping states to understand the behavior of gift-givers, goal-oriented shoppers, etc.
From a customer intelligence side, cohort analysis will observe the behavior of different groups, segments, or cohorts over a given period of time.
From your product analytics, therefore, grouping products together and then comparing them against another cohort of products or categories will allow you to see what factors are influencing the performance.
For example:
How do I leverage this product analytics data point?
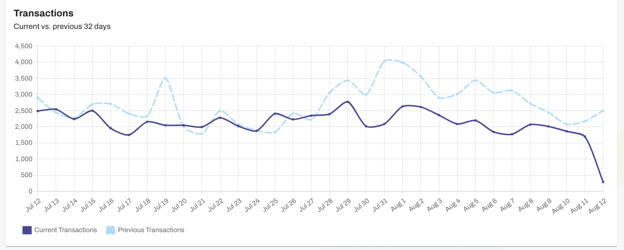
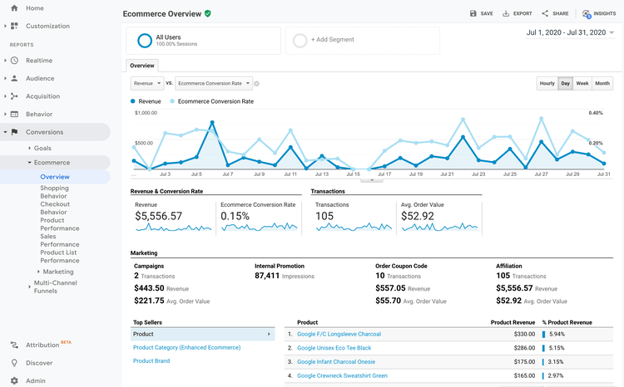
Analyzing daily buys and views over a period of time will help you manage product sales and track trends. This data point is also important to view in a centralized place so you can compare current vs. previous transactions (i.e., product sales).
How do I leverage this product analytics data point?
Observe when your product sales are spiking. If this is easy to tie into a marketing campaign, then you can use this data to show your departments that the campaign is performing, and help inform the strategy of your next marketing initiatives.
Maybe your product sales spikes are spiking based on the season, or as a result of socially trending topics.
For example, if you know the days, times, or months people are buying your products, you can promote them accordingly on those days.
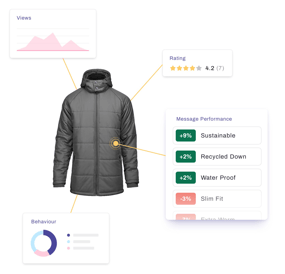
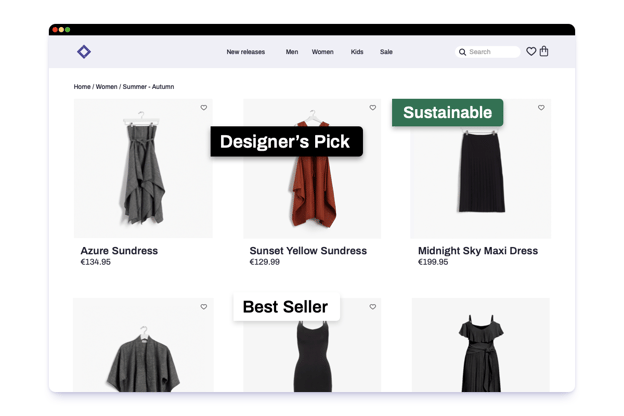
Product attributes are a product’s characteristics that make it special, unique, or different from others in the same category. Displayed as Dynamic Badges (e.g., “Waterproof”) and Notifications (e.g., “Made from real leather”), you can begin testing which product messages drive behavior.
Things like the size, color, shape, or material of your products are all things that fall under product attributes.
By testing which messages lead to increased click behavior, this data shows exactly what components your customers are looking for in your products.
How do I leverage this product analytics data point?
Product attribute messages are insight drivers. Because you’re testing more copy variants and messages, you can get deeper insights into which micro-segments respond to which messages.
For example, if you know that mobile shoppers from Germany respond to “Waterproof” messaging, serve them relevant recommendations or email marketing that highlight your Waterproof products or lines.
You could also use attributes to enrich your SEA campaigns or your on-site SEO, e.g., by showing the attributes in the titles to help your customers find your products faster.
You can also test behavioral messages in a similar way. For example, does a message like “Most Bought” (leveraging the principle of Social Proof) or “Recommended” (leveraging Authority) lead to increased click behavior?
Crobox gives you access to 200+ behavioral messages. So you can also test Principes like Scarcity, Novelty, Innovation, Price sensitivity, etc.
How do I leverage this product analytics data point?
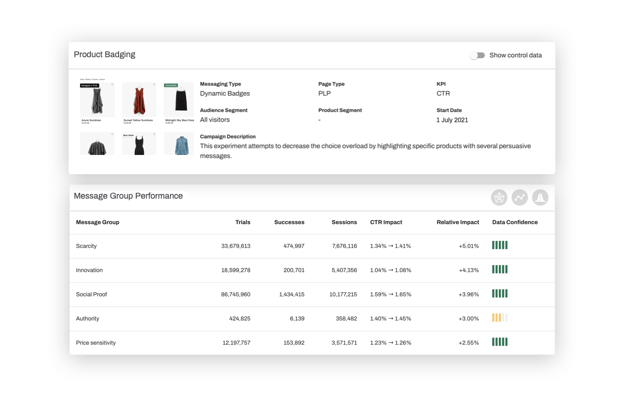
If Social Proof is your best-performing message group, you know to reuse this kind of messaging in your future marketing campaigns.
Match this data to particular customers, and you can even begin to segment based on the psychographics of your shoppers - i.e., what behavioral principles drive purchases.
Other Social Proof variants could be:
Use the best-performing message to optimize your badges, notifications, overlays, and overall communication.
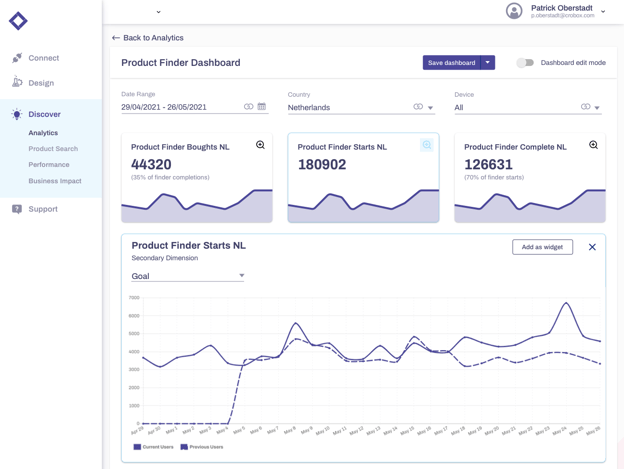
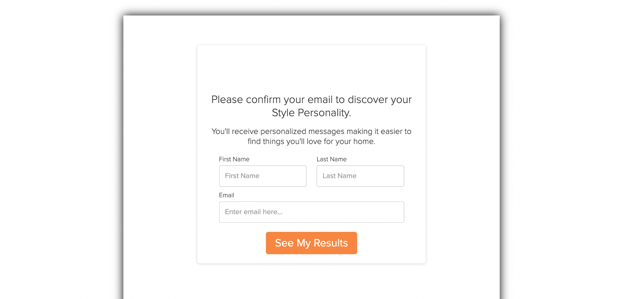
Have you set up a product finder that collects data by asking questions and then recommends a product based on the answers?
Things like product finders or style guides fall into this category. It’s important you collect and analyze the data from your product finders so you can learn from customer behavior and optimize their experience.
How do I leverage these product analytics?
Crobox offers Product Finder results and analytics to visualize your data in one centralized place. Which means it’s easier to make this data actionable.
For example, you can easily measure custom metrics based on your business goals.
Or, you can measure flow data to see at which points in the product finder funnel your customers continue or drop-off. This way you can continuously optimize the performance of the product finder and gain a clearer picture of what your customers are looking for in their products.
Our dashboard is both customizable and shareable, so you can control what data you want to visualize to be able to leverage it across departments.
What we’re talking about in these advanced analytics is something we like to call Product Intelligence because it tells you why your customers buy the products they do.
Your product analytics are the who, what, where, and how of your product data. Product intelligence is the why.
Discovering the why behind the buy leads you to actionable insights. So where your product analytics provide you with the data, product intelligence provides you with assumptions about why this data exists to begin with.
For example,
In short, product intelligence will give context to your data, and allow you to personalize your product messaging and presentation across multiple channels.
Now that you have more unique data points in your eCommerce analytics toolkit, how can you start making data-driven decisions?
Here’s a step-by-step approach you can use every time.
Go to your eCommerce product analytics. Analyze which products are ready to be pushed in a marketing campaign.
For example,
Check which messages, attributes, or metrics are high-performing. These are the data points you want to reuse in your campaign. For example,
Be sure to always measure the performance of your campaign. Optimize your under-performing messages. Continuously test and measure so that the experience is dynamic and personalized.
Here are a few basic eCommerce product analytics tools you can use:
This article has shown you how your eCommerce product analytics can help you compete in the future of retail.
Then, together with our Crobox data expert, showed you some unique data points you can track in your analytics dashboard. Plus, three steps you can follow each to begin leveraging your data for results.
If you want to elevate your product personalization to improve the customer experience, product intelligence is the way forward.
Crobox can give you access to a unique product analytics dashboard while showing you what to do with your data.
Are you ready for the next step?