Search no more, you’ve found the ultimate psychographic research guide with tools, tips, and tricks!

Search no more, you’ve found the ultimate psychographic research guide with tools, tips, and tricks!
Market research is the crux of any brand marketing strategy. But getting started can be difficult and is often prone to mistakes, especially with the vast and different data-sources at your disposal.
With the ever-increasing competition within the retail industry, new approaches have appeared when it comes to getting to know your customers. We want to zoom in on one particularly successful method: Psychographic Marketing Research.
Since the numerous benefits of psychographic data have already been discussed at length, we want to get into the nitty-gritty. We strongly believe that retailers can achieve customer-centricity by acquiring and processing the right kind of data. That’s where psychographics comes in.
In 2018, U.S. companies spent about $19 billion dollars on acquiring third-party data, and about the same amount on third-party solutions to support that data.
That’s over $20 billion (!) wasted on buying a bulk of information and consumer insights from outside sources. And the most ironic part of all, the majority of the data these information brokers have on consumers isn’t even correct.
Thankfully, now that Facebook has decided to stop sharing third-party data with partners and stronger online privacy regulations are in action, companies are being forced to look for different solutions.
Don’t get us wrong - there’s nothing wrong with bringing in some help from outside if you don’t have the right resources or experts at your own disposal. However, you want to make sure that the data acquisition part is handled correctly, without investing time, money, and effort into the wrong places.

So, how do you avoid epic fails such as this? Well, you invest in data that you can derive actionable insights from. It’s about understanding who your most valuable customers are and why they buy from you.
Psychographic research helps you in this by uncovering your shopper’s personality, values, activities, interests, and opinions.
These insights differ from those you can get from demographics, transactional, or behavioral data alone, as psychographics will give you an idea of why a customer is motivated to buy a product.
Before you jump into this wonderful world of research, it’s important to get one thing out of the way. You should remember before you start any kind of customer research:
People are inherently bad at explaining behavior.
Why? Because most of it happens automatically.
We don’t consciously pay attention to the majority of our actions. And when pressed for an answer, our experiences are perceived through our own personal lens, making it hard for us to give an objective account of events.
But just because most decisions are made on autopilot doesn’t mean we can’t try to understand them. However, simply asking someone to delve into their own brain to provide you with an explanation for what they just did will most likely result in the wrong answer.
Let’s be clear, there’s rarely only one factor contributing to a decision. However, bias and personal preference generally make us only see the things we want to see.
To illustrate that thought, let’s consider the following two examples that cloud our (customers) self-evaluation (just two for now, but we could go on).
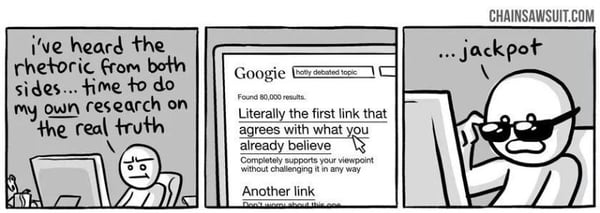
While we’re not always sure why we do the things we do, we like to at least think we’re doing it for the right reasons. This desire is so strong that confirmation bias drives us to look for evidence that supports our past decisions while blocking out contradicting information that is less in favor of our choices.
Using this type of selective reasoning, you can easily justify your decision to buy a brand new smartphone (“It takes such great pictures!”), while ignoring the fact that there’s nothing wrong with your current model or could have spent the money better elsewhere.
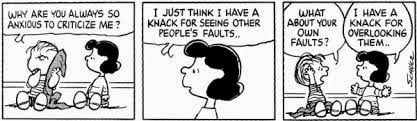
To get an even clearer picture of how subjective our observations are, the attribution bias can’t be excluded from the conversation. Imagine yourself walking down the street and coming across a stranger shouting on his phone. An easy conclusion would be that this person must have a bad temper and likely often acts this way.
Conversely, when it’s our own behavior that’s being called into question, we’re probably not so quick to single out an action as an accurate reflection of our complete personality. What if we just received some bad news, like losing a job or a relationship ending? The fact that we would not give a stranger that benefit of the doubt, is called fundamental attribution error.
The closely related self-service bias dictates that we use those situational explanations only when it suits us. Positive events are always down to internal factors, whereas negative events are blamed on external ones.
With so many biases and psychological marketing tricks, it’s hard for marketers to know if any of the data gathered from customer surveys can be trusted. But generally, there are two approaches that researchers can take.
In 1980, Ajzen & Fishbein developed an attitudinal questionnaire framework built for measuring people’s thoughts and feelings about various topics to predict future behavior. While their tool was widely adopted by behavioral scientists, the attitudinal approach has not been without criticism. If you’ve been paying attention so far, you can probably guess why.
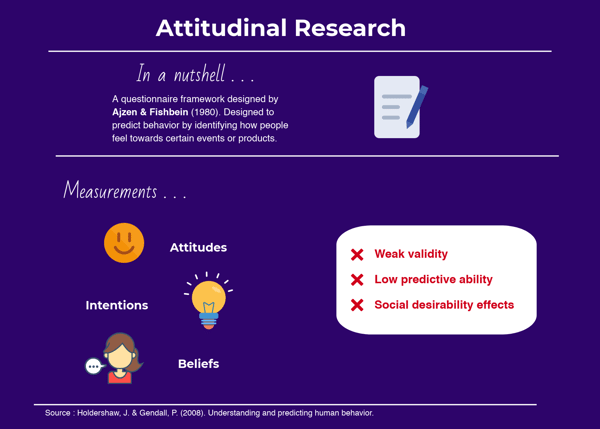
For starters, one of the major downsides of using intangible concepts like attitudes, intentions, and beliefs, is that they’re highly subjective forms of measurement. What one person experiences as an 8 out of 10 level of excitement, it could be just a 5 or a 6 for the next. There’s really no telling which number is right, nor is there any way to verify whether a person is accurately describing how they feel.
And it gets worse. As it turns out, there’s generally little predictive ability to attitudinal questionnaires. Attitudes only explain so much as 40% to 50% of people’s intentions and a mere 19% to 38% of their behavior.
This incongruence often gets blamed on social desirability: when respondents feel the urge to select the answers they think researchers are hoping to hear or to only provide the information that makes themselves look better. Even in completely anonymous settings.
So, instead of focusing on what people say, why not focus on what they do? A fierce advocate of this viewpoint was Patricia J. Labaw, who described attitudes as “mere surface manifestations of larger structural movements, beyond the control or even the consciousness of individuals.”
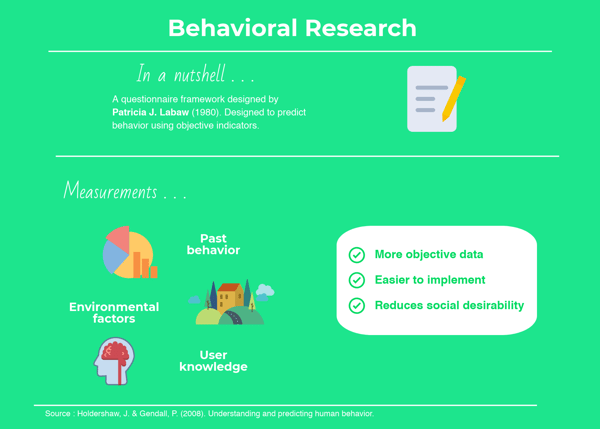
Enter the behavioral framework (1980). By throwing all subjective measurements out and instead focusing on objective indicators such as past behavior, environmental factors, and knowledge, Labaw’s alternative was guaranteed to result in more trustworthy data.
Furthermore, the behavioral questionnaires also turned out to be easier to implement. They solved past issues of social desirability, but other common survey issues like respondent fatigue and question comprehension.
Gartner predicts that by 2025, 25% of marketing departments will have a dedicated behavioral scientist or ethnographer as part of their full-time staff. Understanding human biases is, therefore, key to understanding behavior.
Psychographic research is an advanced way into market research that combines data sources to achieve a holistic picture of your visitors. It’s the necessary step to take to becoming an eCommerce marketer pro.
But how do you find psychographic data?
To give you a basic idea of what we’re talking about - or to refresh your memory - psychographic research is mostly involved with uncovering your shopper’s personality, values, activities, interests, and opinions.
Unlike demographics, transactional, or behavioral data, psychographics gives us an idea of why a certain customer chose to buy a product.
When conducting this research, it's still important to use both attitudinal and behavioral frameworks. As this is the only way to collect feedback, learn to speak the same language, and become empathetic to your customers.
To do this, you ask individuals about their opinions, interests, or experiences with your products using familiar methods such as surveys, user interviews, or focus groups.
Together with this market research, you could use methods like Facebook Pixel to keep track of everything your customers like, view, or share online. However, looking at just how much dirt companies like Facebook and Google already have on us, it’s not hard to imagine why this path quickly leads to resistance.
We would warn against this and opt instead for tracking behavioral data through experimentation on-site. This means also looking to social media to understand the language and personalities of your online target audience.
 eCommerce Warriors using Hotjar tool to track visitors' mouse movements and clicks
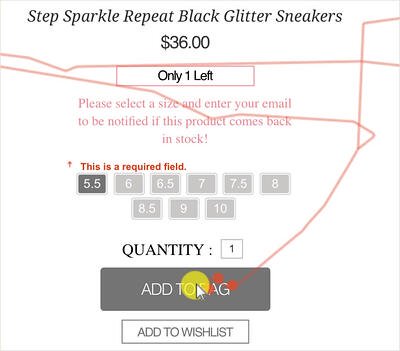
It’s a common misconception that data collection needs to be broad and obtrusive to make an impact. In fact, smaller and focused measurements tend to be more effective. By keeping track of anonymized micro-conversions such as clicks, page views, or adds-to-cart you can already tell a lot about your consumers.
Think about it this way. If you had just lost your keys, you’ll most likely start retracing your steps and try to recall the last place you’ve seen them. So when it comes to figuring out why customers (don’t) choose to buy a product, doesn’t it make more sense to focus your investigation on what’s happening on your website?
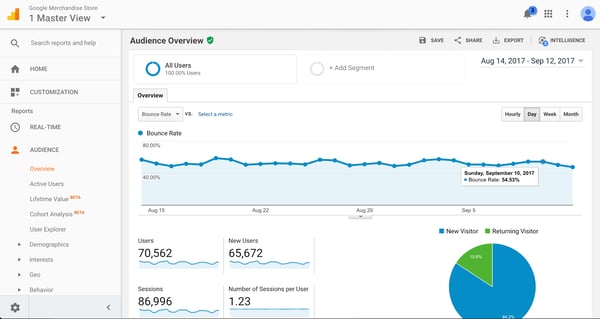
 Tableau data-visualization tool for eCommerce
The next step is selecting the right tools for your analysis. For now, we’ll stick to micro-conversions, but if you’re looking to add surveys to your research as well - for example, if there’s something more specific you want to ask your audience - then there are plenty of digital tools for that.
When it comes to measuring on-site behavior, Google Analytics is a good place to start.
While it is one of the more basic tools for this purpose, it has a relatively low learning curve, and more importantly: it’s free.
For a more in-depth explanation of all the things you can do with Google Analytics, I’d recommend Neil Patel’s walkthrough.
Or, if you’re in a hurry, check these pointers:
These features combined should be enough to give you a basic understanding of what’s happening on your website. Google Analytics a great place for newcomers to use psychographics.
However, if you’re looking to invest in more in-depth analysis, you might try out some alternatives like Mixpanel, Kissmetrics, Amplitude.
At Crobox, for example, we have advanced analytics that runs product badge experiments to understand which product benefits are most likely to drive purchase behavior. This allows better understanding of what attributes your customers seek in your products.
With this data, retailers can segment audiences based on their psychographic profiles omnichannel.
For instance, if we want to test sustainability tags, we can see which demographics are driven to buy in a more eco-friendly way. This is a value that can then be highlighted when delivering those segments with marketing campaigns.
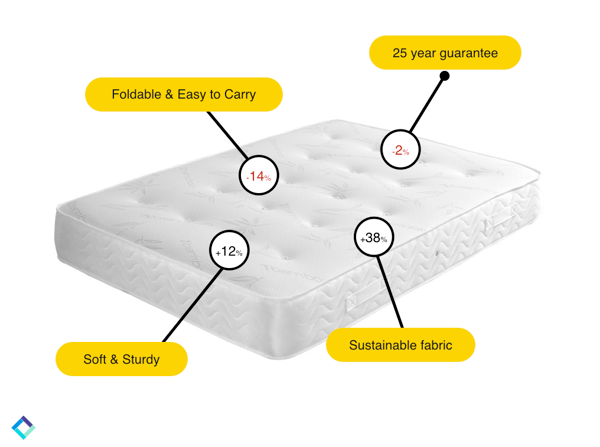 Crobox experiments highlight product attributes. We monitor the CTR to gauge which drive the most behavior for various segments. In this example, “Sustainable fabric” drives the highest CTR for this segment. These insights can be used in various marketing campaigns to improve the relevancy of your marketing messages.
This brings us to our next point and perhaps the most important one of all. While psychographics have been receiving their fair share of buzz, there’s still one part that most people working with psychographics tend to overlook:
Behavioral science.
Behavioral science should be the backbone of your marketing insights because they provide meaning and a human touch to your data.
An easy way to make sense of behavior is by making use of the BJ Fogg model. In short, this theory states that promoting desired behavior depends on three factors: motivation, ability, and triggers.
Psychographics and demographics provide us with insight into the first two parts of the equation. If the motivation and ability are both there, a person becomes a potential customer for your product.
However, whether or not they will act on that potential, depends on the presence of the right trigger. Different situations call for different triggers (or different types of nudges), and behavioral science is what helps us to determine which one is best suited to your customer.
 Email campaign mockup stressing sustainability as the product USP of the mattresses
This examples shows how an email campaign could leverage the insight that "Sustainable fabric" drives purchase behavior. The same approach can be used to test different kinds of copy but also different psychological principles (e.g., scarcity or social proof).
It’s nice to know your audience’s interests, habits, and opinions. After all, those are the values that separate friends from acquaintances and how you become better valued in the eyes of your customers.
But as marketers looking not just to acquire friends, but to continue to please them, making your strategy both profitable and valid, you’ll need to remember the following steps:
So, you did your groundwork, tested out a few new strategies on your website, and learned a bit more about your customers.
While there is plenty of evidence that suggests at least part of our psychological tendencies are hardwired, most of our human behavior is dynamic. The way we think, act, or feel can change over time and across different situations. This variation results in different shopping states, another factor to take into account during your analysis.
So the key is to keep testing new variables at various times to build on what you know. Try out different copy variances for different products, and keep striving for even more detailed and dynamic customer segments.
Common A/B testing experiments work by running two versions of a website simultaneously: often a regular one (control condition) and a slightly altered version.
A/B testing offers several advantages, such as:
But to make your life easier you could automate your testing process with AI as this will enable you to perfect your craft.
Moreover, just as human behavior is in constant flux, so are shopping seasons and shopper demands. In winter, your customers will be attracted to different products than they are in the summer, or during Black Friday.
Tracking real-time data is thus as important as predictive analytics. And once again, AI can help automate these processes to stay up to date on trends, seasonality, and shopper demands.
Psychographic data supplants your other data sources with rich insights based on understanding your customer’s values, habits, interests, etc. It’s the new way forward in marketing research as it takes into account cognitive biases present in shopping behavior.
For all you eCommerce pros out there, psychographic research is easy to uncover by finding the right combinations from your data sources. And to find these you can, once again: